
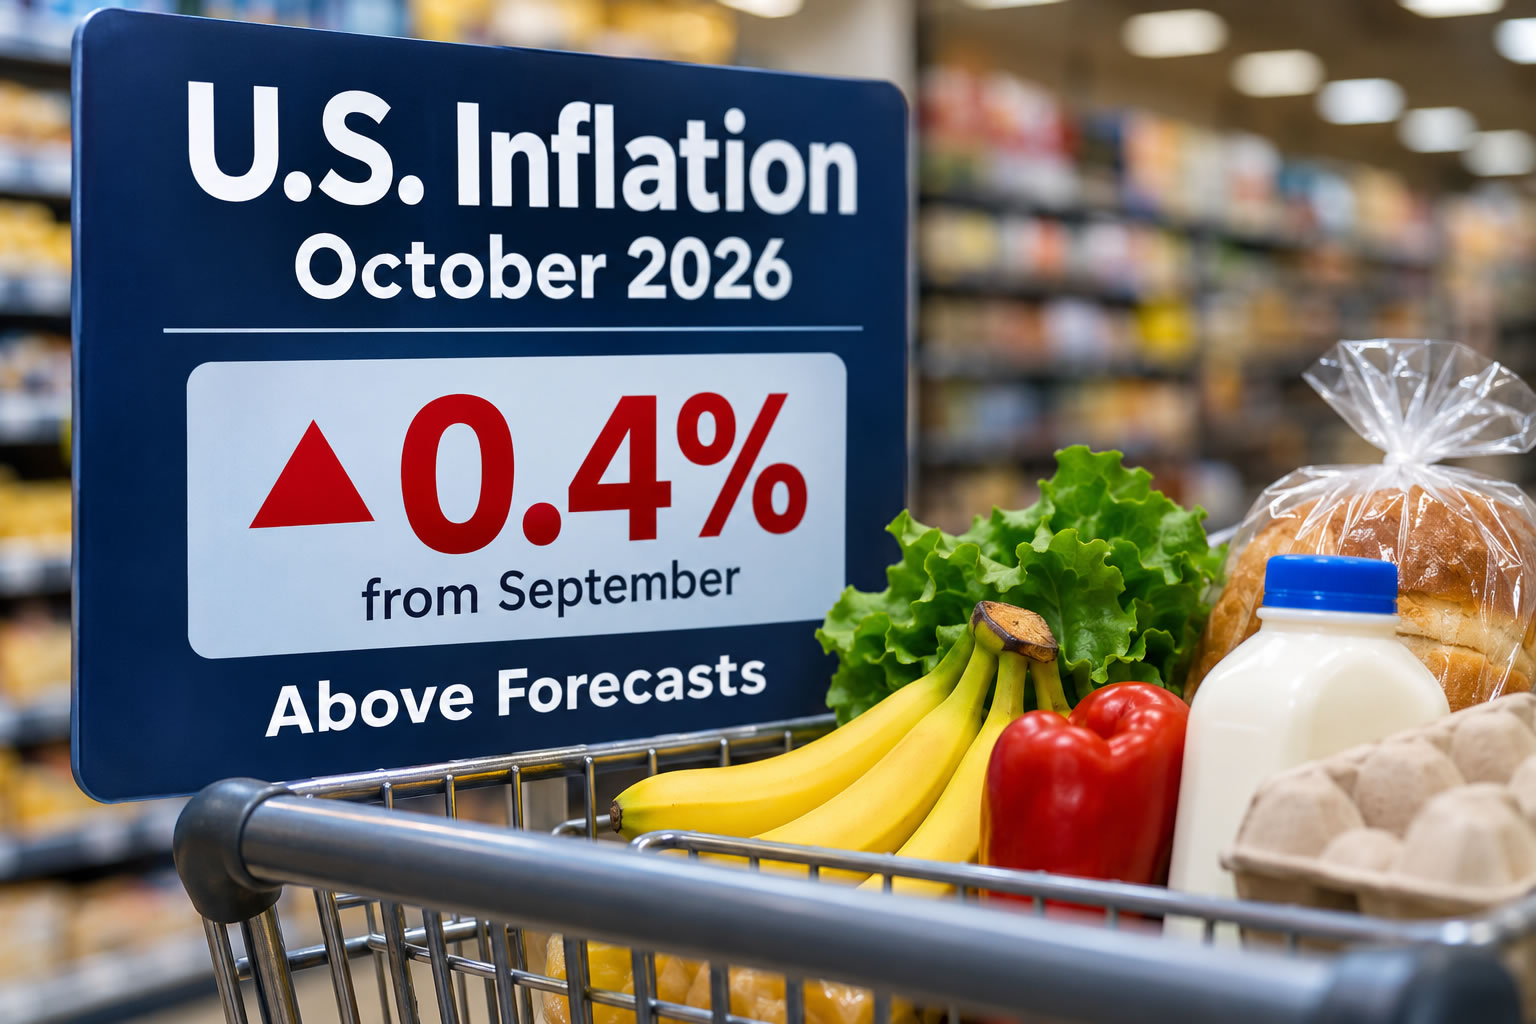
Inflation slowed in October but exceeded expectations as higher food and shelter costs continued to pressure U.S. consumers, according to figures released Tuesday by the Labor Department. The report also lacked an annual inflation rate because of missing data from last year’s government shutdown.
Prices paid by U.S. consumers rose 0.4% in October, according to the latest Consumer Price Index (CPI) report from the U.S. Bureau of Labor Statistics, slowing from a 0.6% increase in September but exceeding forecasts for a 0.3% gain.
The CPI, a key measure of inflation, tracks changes in prices paid by American consumers for a broad range of goods and services, from groceries to gasoline.
Unlike most monthly releases, the October report did not include an overall annual inflation rate. The 2025 government shutdown prevented the BLS from collecting October 2025 price data, leaving it unable to calculate year-over-year changes for most categories. September’s headline inflation rate of 3.7% and core rate of 2.6% remain the latest available annual figures.
Looking at food costs, prices increased 0.5% in October after holding steady in September. Grocery prices climbed 0.4% following a 0.1% decline, while restaurant prices rose 0.5% after a 0.2% gain the previous month.
Among grocery categories, beef prices rose 0.9%, while fruits and vegetables and dairy products each increased 0.6%. Snack prices advanced 1.0%. In contrast, nonalcoholic beverage prices fell 0.3%, and cereals and bakery products were unchanged.
Energy prices continued to rise in October, but at a substantially slower pace than in September. Gasoline prices increased 1.0% after surging 9.1% the previous month. Despite the slowdown, pump prices were 37.4% higher than a year earlier, one of the few annual comparisons available in the report.
The broader energy index, which includes gasoline, electricity and fuel oil, advanced 0.7% in October following a 5.2% jump in September. Electricity prices climbed 0.9%, while natural gas prices declined 0.8%. Fuel oil prices rose 2.0%.
Excluding the volatile food and energy components, core consumer prices rose 0.3% in October for the third consecutive month, exceeding forecasts for a 0.2% increase.
Shelter costs climbed 0.3% in October after rising 0.4% in September, accounting for more than 30% of the overall monthly CPI increase. Owners’ equivalent rent increased 0.3%, while residential rents rose 0.2%. Lodging away from home, including hotels and motels, advanced 0.6% following a 2.0% increase in September.
The shelter component of the CPI includes apartment rents, owners’ equivalent rent — an estimate of what homeowners would pay to rent their homes — lodging away from home, housing at schools, and tenants’ and household insurance.
In other key categories:
- Clothing prices edged up 0.1% in October after rising 0.3% in September.
- New vehicle prices increased 0.2% for the second consecutive month and were 0.7% higher than a year earlier.
- Used car and truck prices fell 1.2% in October after climbing 0.7% in September and were 3.3% lower than a year ago.
- Airline fares rose 0.4% in October, slowing from increases of 1.2% in September and 2.7% in August.
- Recreation prices climbed 0.8% after rising 0.5% in September, while motor vehicle insurance increased 0.7%.
- Medical care costs advanced 0.3%, with hospital services rising 0.8% and physicians’ services increasing 0.4%.
The latest available headline annual inflation rate was 3.7% in September, up from 3.4% in August.
Similarly, annual core inflation last stood at 2.6% in September, compared with 2.4% in August. The core CPI, also known as the "all items less food and energy" index, is among the inflation measures monitored by Federal Reserve policymakers to assess price trends and guide monetary policy decisions.
The following table of key inflation figures covers the seven months through October, as published by the U.S. Labor Department’s Bureau of Labor Statistics (www.bls.gov/cpi) on November 10, 2026. To compile the CPI, the BLS collects prices each month in 75 urban areas from about 6,000 housing units and approximately 22,000 retail establishments.
April 2026 to October 2026 Consumer Prices – Gains & Losses in Percent
(Seasonally Adjusted from Prior Month and Unadjusted 12-Month)
| April 2026 | May 2026 | June 2026 | July 2026 | Aug 2026 | Sep 2026 | Oct 2026 | 12-Month | |
| All items | 0.6 | 0.5 | -0.4 | 0.1 | 0.4 | 0.6 | 0.4 | – |
| Food | 0.5 | 0.2 | 0.2 | 0.1 | 0.1 | 0.0 | 0.5 | – |
| Food at home | 0.7 | 0.1 | 0.2 | -0.1 | 0.0 | -0.1 | 0.4 | – |
| Food away from home | 0.2 | 0.3 | 0.2 | 0.3 | 0.3 | 0.2 | 0.5 | – |
| Energy | 3.8 | 3.9 | -5.7 | -1.5 | 2.1 | 5.2 | 0.7 | – |
| Energy commodities | 5.6 | 6.7 | -9.5 | -2.9 | 4.2 | 9.3 | 0.8 | – |
| Gasoline (all types) | 5.4 | 7.0 | -9.7 | -2.9 | 3.9 | 9.1 | 1.0 | 37.4 |
| Fuel oil | 5.8 | 3.8 | -9.2 | -1.7 | 10.1 | 15.3 | 2.0 | – |
| Energy services | 1.6 | 0.4 | -0.7 | 0.3 | -0.4 | 0.1 | 0.6 | – |
| Electricity | 2.1 | 0.6 | -1.0 | 0.1 | -0.2 | 0.2 | 0.9 | – |
| Utility (piped) gas service | -0.1 | -0.5 | 0.5 | 0.7 | -1.1 | -0.3 | -0.8 | – |
| All items less food and energy | 0.4 | 0.2 | 0.0 | 0.2 | 0.3 | 0.3 | 0.3 | – |
| Commodities less food and energy | 0.0 | -0.1 | -0.1 | 0.2 | 0.1 | 0.3 | 0.2 | – |
| New vehicles | -0.2 | -0.3 | 0.0 | 0.1 | 0.3 | 0.2 | 0.2 | 0.7 |
| Used cars and trucks | 0.0 | 0.1 | -0.2 | 0.4 | 0.4 | 0.7 | -1.2 | -3.3 |
| Apparel | 0.6 | 0.3 | -0.6 | 0.1 | 0.0 | 0.3 | 0.1 | – |
| Medical care commodities | -0.4 | -0.7 | -0.2 | -0.6 | -0.2 | -0.7 | 0.5 | – |
| Services less energy | 0.5 | 0.3 | 0.0 | 0.2 | 0.3 | 0.4 | 0.3 | – |
| Shelter | 0.6 | 0.3 | 0.1 | 0.1 | 0.3 | 0.4 | 0.3 | – |
| Transportation services | 0.3 | -0.6 | -0.3 | 0.3 | 0.5 | 0.6 | 0.8 | – |
| Medical care services | 0.0 | 0.5 | -0.1 | 0.6 | -0.2 | 0.3 | 0.3 | – |
Note: Most October 2026 annual inflation comparisons were unavailable because of missing October 2025 data resulting from the government shutdown. Dashes indicate unavailable figures.
The BLS releases inflation data around the middle of each month, covering consumer prices through the previous month. The next CPI report, covering November 2026, is scheduled for December 10 at 8:30 a.m. ET.
The CPI data are also used to calculate inflation rates and power this site’s U.S. Inflation Calculator, which displays the cumulative inflation and the change in the buying power of the U.S. dollar over time.
